Projects
About Me
Contact
Projects
About Me
Contact
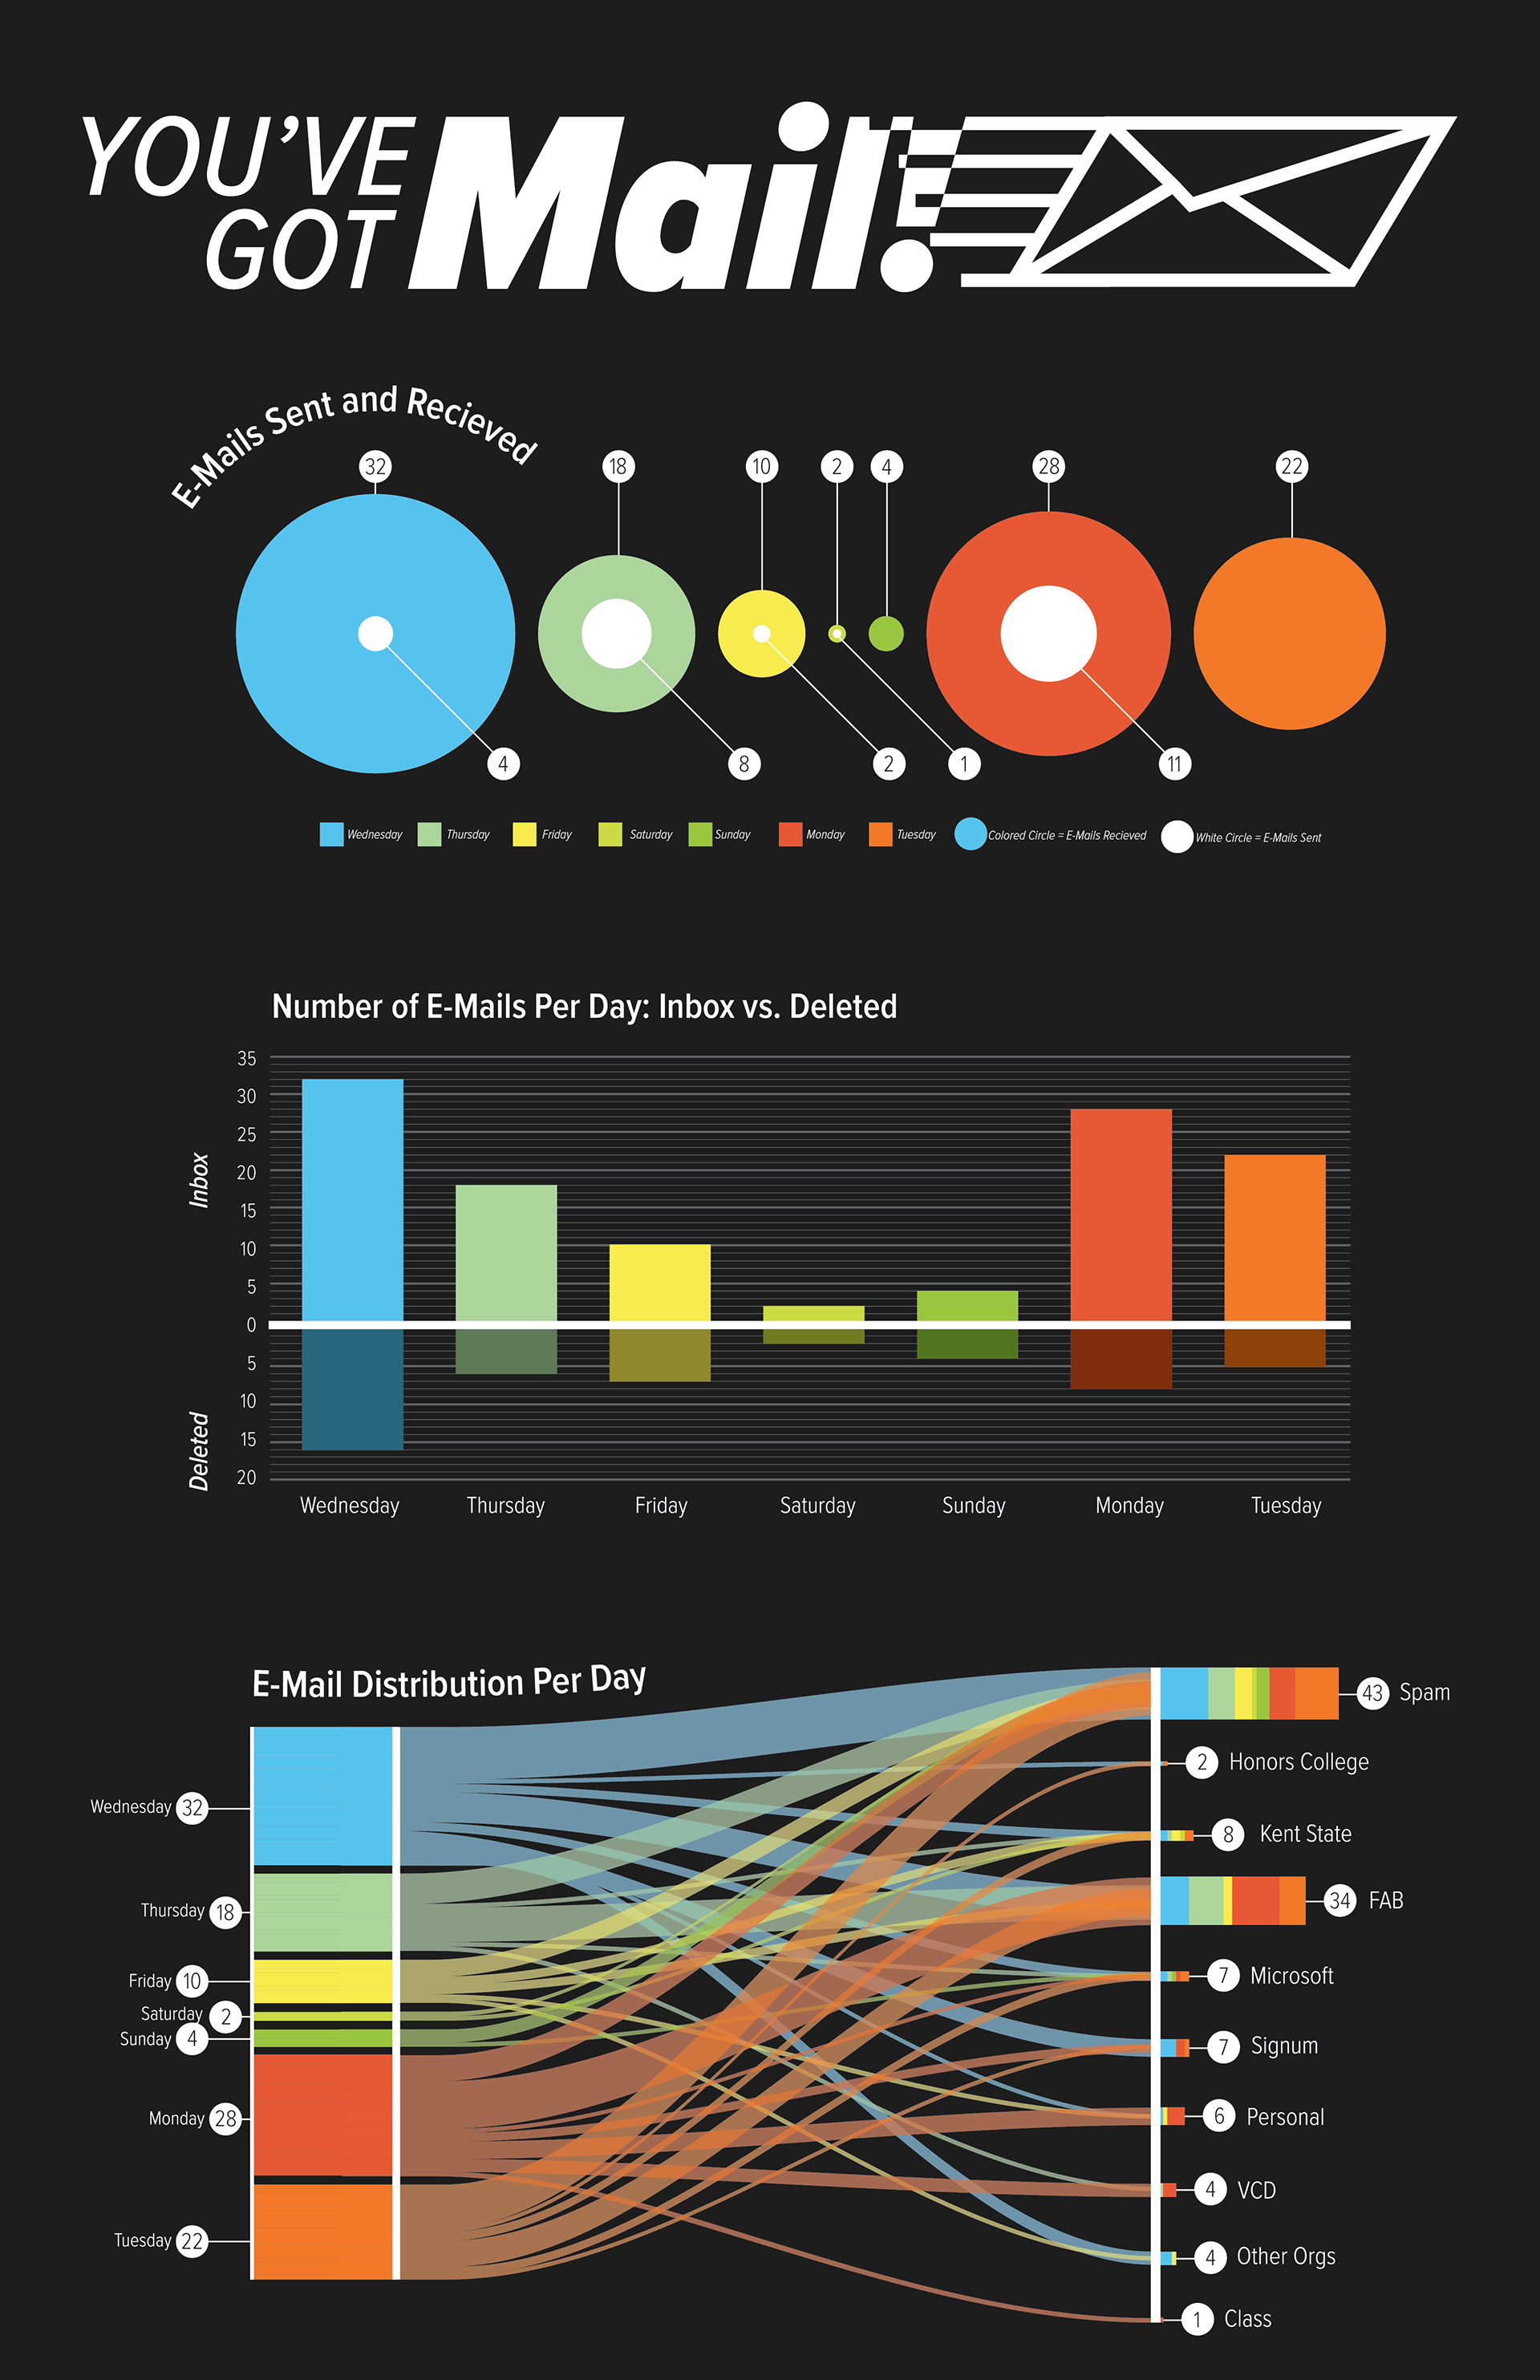
You've Got Mail
This graphic was created from data that I collected about my university email. I represented three different types of data in different visual formats. I created this using Adobe Illustrator.
↑
Back to Top